In this article
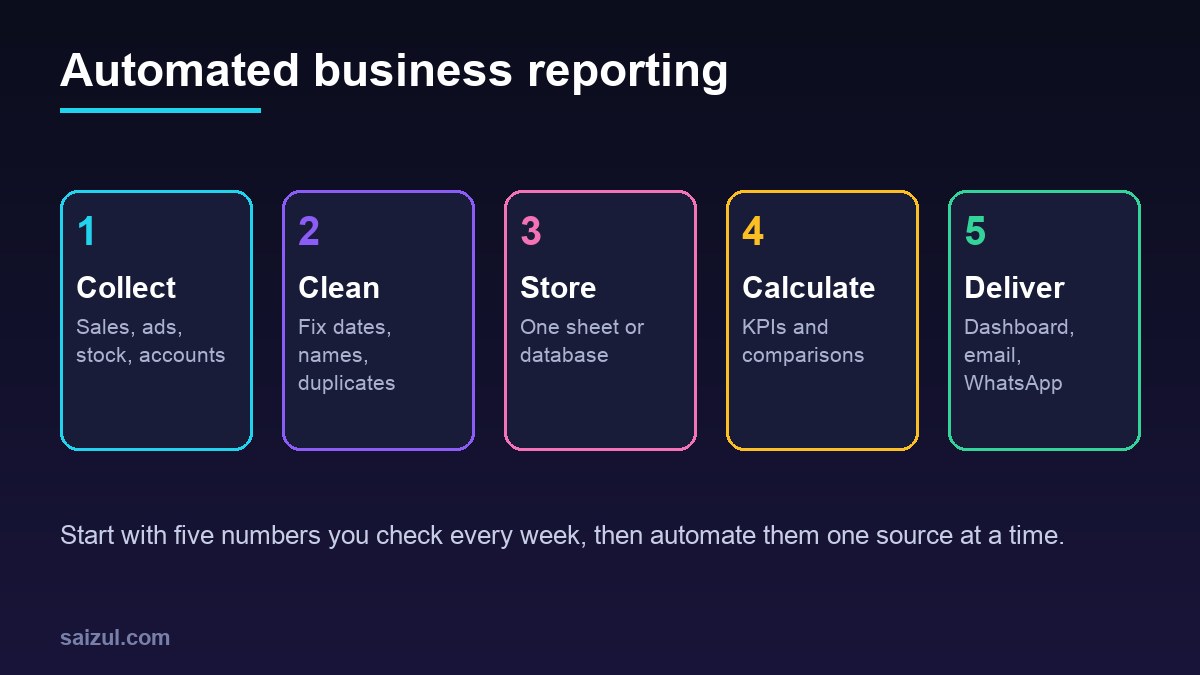
Automated business reporting collects numbers from the systems you already use, such as your online store, point of sale, ad accounts, stock records and accounting software, calculates the key figures and delivers them to you on a schedule, without anyone copying data into a spreadsheet. For a business owner, that means a short daily or weekly report on WhatsApp or email, and a dashboard to dig deeper when something looks wrong. This guide explains how to choose the right KPIs, which data sources to connect, dashboards versus scheduled summaries, how AI can add written commentary, how to keep the numbers trustworthy and what it costs.
From my own work: A pattern I often see: a manager spends every Monday morning exporting files from three or four systems, pasting them into a spreadsheet and sending a screenshot to the owner. By the time it arrives, nobody remembers what to do with it. When the same numbers arrive automatically at 9am with last week’s comparison, people actually start acting on them.
This guide is about business reporting across systems. For website traffic reporting specifically, see my Google Analytics 4 setup guide. For the wider picture of what can be automated, read AI automation for small business.
Why automate business reporting?
- Time: manual reports often take several hours a week, every week.
- Speed: problems such as falling sales, rising ad cost or stock running out are seen in a day, not at month end.
- Consistency: the same formula every time, instead of numbers that change depending on who made the report.
- Fewer copy errors: no pasting into the wrong column.
- Better decisions: when numbers are easy to see, owners and managers discuss them more.
Automation does not replace judgment. It removes the collecting and copying, so the time goes into asking why a number moved and what to do next. A good test of whether a report is worth automating: if it is made by hand at least once a week and someone acts on it, it is a strong candidate.
Choose the KPIs before the tools
The most common mistake is building a dashboard with 40 charts that nobody reads. Start with five to ten numbers you would act on. Examples by business type:
| Business type | Useful KPIs | Typical sources |
|---|---|---|
| Online store | Orders, revenue, average order value, return or cancellation rate, ad cost per order | Store platform, courier, ad accounts |
| Retail with branches | Sales per branch, gross margin, stock value, fast and slow sellers | Point of sale, stock records |
| Service business | New leads, quotes sent, jobs won, revenue, unpaid invoices | CRM, accounting |
| Clinic or salon | Appointments, no-shows, revenue per staff, rebooking rate | Booking system, accounting |
| Agency or consultancy | Billable hours, utilisation, revenue per client, overdue invoices | Time tracking, accounting |
For each KPI write a one-line definition: the formula, the source, and whether it includes tax, returns or cancelled orders. Agreeing on definitions is half the project.
Connecting your data sources
Most modern tools offer an API or a scheduled export. Common sources:
- Store and point of sale: WooCommerce, Shopify and most POS systems have APIs for orders and products.
- Website analytics: the Google Analytics Data API gives programmatic access to GA4 report data (Google Analytics Data API).
- Ad accounts: Meta and Google Ads both provide reporting APIs for spend, clicks and conversions.
- Accounting: most cloud accounting tools expose invoices, bills and payments.
- Spreadsheets: if some data still lives in sheets, the Google Sheets API lets software read and write them (Google Sheets API).
- Older desktop software: may need a scheduled export file or a direct database connection.
A workflow tool such as n8n, Make or Zapier can pull data on a schedule. In n8n, the Schedule Trigger node runs a workflow at fixed intervals or set times (n8n Schedule Trigger). My comparison of n8n vs Make vs Zapier helps you choose.
Where to store the data
| Option | Good for | Limits |
|---|---|---|
| Google Sheets | Small volumes, quick start, owners who like sheets | Slows down with large data; easy to break by editing |
| Database such as PostgreSQL | Growing volumes, many sources, history over years | Needs setup and someone to maintain it |
| Built-in reports of one tool | When nearly all data is in one system | Hard to combine with other sources |
A practical path is to start with a sheet and move to a database when it gets slow or when several sources need joining. My technical guide to syncing Google Sheets and PostgreSQL with n8n covers that step.
Dashboards vs scheduled summaries
You usually want both.
- Scheduled summary: a short message every morning or Monday with the key numbers, the change from the previous period and anything unusual. Delivered where the owner already looks: WhatsApp, email or a team chat.
- Dashboard: an interactive page to filter by branch, product, channel or date when you need detail. Free and low-cost tools such as Looker Studio (Looker Studio) or open-source Metabase (Metabase docs) connect to sheets and databases.
- Alerts: instant messages when something crosses a line, for example daily sales below a set level, ad cost per order above a limit, or a product below its reorder point. See my guide to inventory management for online stores for stock rules.
An example weekly summary
A good summary is short and comparative. For example: “Last week: 412 orders (up 8 percent on the week before), revenue 1.9 million taka (up 5 percent), average order 4,610 taka. Ad cost per order rose from 310 to 365 taka. Return rate 6 percent. Three products are below reorder level.” These figures are made up for the example; yours come from your own data.
Adding AI commentary to reports
An AI model can turn the numbers into a few sentences of explanation: what changed most, which branch or product caused it, and what to check. This is useful for owners who prefer reading to charts. Keep it safe:
- Calculate all numbers with normal code or formulas first. Let the AI only describe the results, not do the maths.
- Give it the figures and the comparison periods, and ask it to quote numbers exactly.
- Ask it to say “possible reasons”, not to state causes as facts.
- Keep the raw table in the same message so anyone can check.
Keeping the numbers trustworthy
- One definition per KPI, written down and shared.
- Time zone and cut-off: decide whether a day ends at midnight local time and use it everywhere.
- Cancelled and returned orders: decide how they are counted.
- Duplicate checks: the same order can appear from two sources.
- Reconcile monthly: compare report totals with your accounting figures and explain differences.
- Failure alerts: if a data pull fails, the report should say so instead of showing zero.
- Access control: not everyone needs to see margins or salaries.
What automated business reporting costs
Rough 2026 estimates:
- Simple setup (two or three sources into a sheet, a weekly summary and a basic dashboard): often a few days of work, roughly 500 to 2,500 US dollars.
- Multi-source reporting (database, several branches, alerts, AI commentary): commonly 2,500 to 12,000 US dollars depending on sources and data quality.
- Running costs: a small server or workflow tool plan, dashboard tool if paid, and occasional fixes when a source changes its API.
If you self-host the workflow tool, my self-hosted n8n production guide covers backups and updates.
How to set up automated business reporting: step by step
- Write down the five to ten KPIs and their definitions.
- List the source for each number and check API or export access.
- Connect the most important source first, usually sales.
- Store the data in a sheet or database with a date on every row.
- Calculate the KPIs and compare them with the previous period.
- Send a weekly summary and check it against your manual report for a few weeks.
- Add the dashboard, then alerts.
- Add AI commentary last, once the numbers are trusted.
- Review the KPI list every quarter and remove numbers nobody uses.
Common mistakes
- Building a large dashboard before agreeing which numbers matter.
- Different people using different definitions of “sales” or “orders”.
- Reports that show zero when a connection fails, so a broken pull looks like a bad day.
- Pulling every field from every system, which makes the setup slow and fragile.
- Sending the full report to everyone, including staff who should not see margins.
- No owner for the reporting setup, so it quietly breaks when a tool changes its login or API.
- Never removing KPIs, until the summary is too long for anyone to read on a phone.
Quick checklist
- Five to ten KPIs with written definitions.
- Sources listed with access confirmed.
- Time zone, cut-off, returns and cancellations agreed.
- Data stored with dates and source names.
- Weekly summary checked against manual figures.
- Dashboard with filters for branch, product and channel.
- Alerts for the few numbers that need instant action.
- Failure alerts if a data pull breaks.
- Monthly reconciliation with accounting.
Need help with this on your own site or business?
I build and secure WordPress sites, web apps and AI automations end to end, in Bangla and English: a free discovery call, a written scope with a fixed quote, a focused first version, then testing, deployment and monitoring.
See the portfolio and the AI agent services, or tell me what you need.
FAQ
What is automated business reporting?
It is a setup that pulls data from your business systems on a schedule, calculates key figures and sends them to you as a summary, dashboard or alert, without manual copying into spreadsheets.
Do I need a data warehouse for automated reports?
Not at first. Many small businesses start with Google Sheets or one database. Move to a larger setup when data volume, number of sources or history makes the simple option slow.
Can I get my business report on WhatsApp?
Yes. A workflow can send a short daily or weekly summary to WhatsApp, email or a team chat. Business-initiated WhatsApp messages through the official platform need approved templates.
Which KPIs should a small business track?
Track five to ten numbers you would act on, such as sales, gross margin, orders, ad cost per order, unpaid invoices and stock below reorder level. The right list depends on your business model.
Can AI analyse my business data?
AI can describe trends and suggest what to check, but numbers should be calculated by normal formulas first. Treat AI commentary as a starting point for questions, not as proof of causes.
Sources

Md Saizul Amin
Digital Systems Strategist · AI Agent Developer · 9+ years in digital & ITMd Saizul Amin is a digital systems strategist and AI automation engineer from Dhaka, Bangladesh. With 9+ years across IT, web development and digital marketing, he writes practical guides on technology, business, education and online growth — and builds the same kinds of systems (AI agents, websites, SEO and ad campaigns) for clients in Bangladesh, the UK and the USA.
Specialist in
Credentials & experience
- 🎓B.Sc. in Computer Science & EngineeringBangladesh University of Business & Technology (BUBT), 2017–2021
- 🤖AI Automation Engineer · Web Developer · SEO SpecialistUnique Mark Limited, Birmingham UK — 2024 to present
- 🌱IT SpecialistGreen Fund Initiative Inc., USA — 2024 to present
- 🏥Junior IT Consultant — Ministry of Health (DGHS)Built the first national Shareable Health Record website; supported 6,000+ facilities
- 🧭Head of ITWEDO Bangladesh — led IT for 50+ staff, 2021–2023